Your Skills Are a Graph, Not a List: Why the Way You Map Them Changes Everything
Skill mapping for engineers fails when skills sit in a flat list. A graph shows depth, connections, and the clusters that actually transfer.
Skill Graph Team••7 min read
You have probably seen the skills section at the bottom of a résumé: a comma-separated list of technologies, frameworks, and soft-skill adjectives. Python, Kubernetes, leadership, communication. It looks organised. It is not.
Skill mapping for engineers fails at the data structure. A list pretends every skill is a peer. It hides what depends on what, what you can actually transfer, and which items are decoration. Interview answers then sound like a tour of that list: one disconnected claim after another.
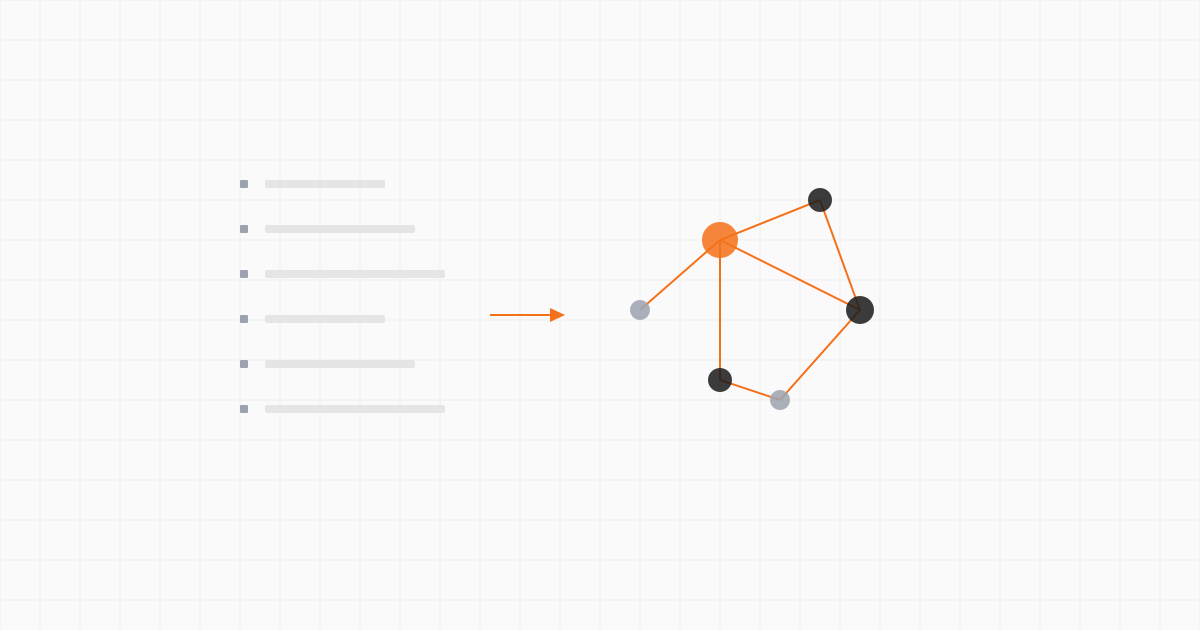
A graph is the honest model. Skills have neighbours, depth, and proof. Once those three are visible, career planning stops being a shopping list and starts looking like a map.
Why skill mapping for engineers fails as a list
A list has two structural defects. Both show up in hiring, and both show up when you try to decide what to learn next.
False equality. "Git" sitting next to "distributed systems" tells a recruiter nothing about depth. Tutorial exposure and production ownership look identical. You know they are not. The document does not.
Hidden edges. React is not independent of JavaScript. PostgreSQL is not independent of data modelling. A list cannot show that a strong Python node is what makes the data-pipeline node real. Recruiters then under-read transfer. You then over-invest in isolated tools that do not unlock anything else.
There is a third defect that is more social than structural. Lists invite status ordering. People put the fashionable names first. Kubernetes above SQL. "AI" above testing. That order is not a skill inventory. It is a marketing sort. It trains you to talk about prestige instead of transfer.
LinkedIn's Future of Recruiting reports that 73% of recruiters now prioritize skills-based hiring. They still have to verify those skills with tests and work samples, because a list of names is not evidence. Mapping skills as a graph does not replace that verification. It stops you from confusing a keyword dump with a capability model.
Ready to map your competitive advantage?
Stop guessing your next move. Visualize your skills, identify gaps, and grow with AI-powered guidance.
List versus graph: the same engineer, two models
Take a mid-level backend engineer who would normally write:
Python, FastAPI, PostgreSQL, Redis, Docker, AWS, CI/CD, REST, system design
That string is what most skill-mapping templates produce: an inventory. Now force the same person to name depth, neighbours, and proof.
Skill
Depth
Connects to
What the list hid
Python
Proficient
FastAPI, data modelling, testing
The actual centre of gravity
FastAPI
Working
REST design, auth, observability
Built two services, never owned versioning
PostgreSQL
Proficient
data modelling, query tuning
Stronger than the "AWS" line implies
Redis
Exposure
caching
One cache-aside tutorial, no eviction design
Docker
Working
CI/CD, local env
Compose files, not image hardening
AWS
Exposure
Docker, CI/CD
Used S3 and ECS with a senior watching
CI/CD
Working
Docker, testing
GitHub Actions for tests, not production rollout
REST design
Proficient
FastAPI, auth
The transferable skill AWS does not capture
System design
Working
REST, PostgreSQL, Redis
Interviews expose this as the real gap
The list said "AWS." The graph says AWS is a thin leaf hanging off Docker, with no independent proof. The list said "system design." The graph says the engineer can design CRUD APIs and has never reasoned about backpressure. That is the interview failure waiting to happen.
Notice the hierarchy flipped. PostgreSQL and REST design are load-bearing. Redis and AWS are not. A résumé skills section would have sold the opposite story, because cloud logos sort higher than query plans.
This is why a personal skill graph is a different object from a skills matrix or a LinkedIn endorsement pile. Nodes, edges, depth, evidence. Drop any one of those and you are back to a list with extra formatting.
Transfer lives in a cluster, not a talent
Engineers who "pick things up quickly" are usually sitting on a dense cluster, not a personality trait.
A concrete case: an engineer with proficient Python, working data modelling, and working testing. That cluster already supports FastAPI, batch jobs, simple ETL, and internal tools. Adding "Airflow" is a small edge. Adding "Kubernetes" is a long walk: containers, networking, rollout strategy, observability. The list treats Airflow and Kubernetes as two more nouns. The graph shows one is adjacent and one is a different region.
Transferable clusters show up the same way in interviews. When a hiring manager asks about a missing tool, the useful answer is not "a fast learner." The useful answer is the neighbour:
"No production Kubernetes. The closest cluster is Docker Compose plus GitHub Actions for a three-service app. The gap is orchestration and rollout, not containers."
That sentence is only possible if the map exists. Without it, people either overclaim the missing tool or undersell the adjacent proof.
The same structure catches fake T-shapes. Plenty of résumés show a deep spike in a fashionable area and a scatter of unrelated leaves. A graph makes the scatter obvious: a "machine learning" node attached to nothing but a Coursera certificate, while the real dense cluster is backend APIs. Better to deepen the real cluster than to decorate the graph with a disconnected spike.
A personal skill mapping worksheet
Do this on paper or in a spreadsheet. Do not start in a design tool. The point is honesty, not a pretty network diagram.
1. Dump, then split. Write every skill you would put on a résumé. Then split each line into a capability ("query tuning") and a tool ("PostgreSQL"). Tools can be nodes. Capabilities should be nodes too. If you only keep tools, you will miss the transferable layer.
2. Score depth in four buckets. Exposure: followed a tutorial or reviewed someone else's work. Working: shipped it with guidance or in a narrow slice. Proficient: owned it independently, including the ugly parts. Expert: other people come to you, and you can teach tradeoffs. If you hesitate between two buckets, take the lower one.
3. Attach one piece of proof per node you mark working or above. A PR, a design doc, a dashboard, a deployed URL, a postmortem, a talk. "Used it at work" is not proof. If you cannot name an artifact, the depth score is probably exposure.
4. Draw only the edges you can explain. Connect A to B if you have used A to do B, or if B is blocked without A. Do not connect things because they "feel related." Python to FastAPI is an edge. Python to "communication" is not, unless you have a specific artifact (an RFC, an API guide) that required both.
5. Circle clusters, not celebrities. A cluster is three or more connected nodes at working or above. Name each cluster in plain language: "HTTP APIs and data," "build and deploy," "model evaluation." Those names are how you should talk in interviews. The celebrity nodes (Kubernetes, "AI") only matter if they sit inside a cluster.
6. Mark the load-bearing gap. Compare the clusters to one target role. Find the missing node that would unlock the most adjacent work. That is the next learning target. Not the skill with the best branding.
If you want a faster first pass, building a graph from a CV extracts an initial set of names and depths. Treat that output as a draft of steps 1-3, then do steps 4-6 yourself. Automated extraction is good at names. It is bad at lying to you about depth.
Use the map in the room, not just in the spreadsheet
Skill mapping that never leaves a worksheet is journaling. The payoff is in how you talk.
Before an interview, pick the three clusters that match the role. For each cluster, prepare one story that walks an edge: problem, constraint, decision, artifact. Do not prepare a story per tool. Tools are props. The edge is the plot.
When a question names a tool you do not have, answer with the nearest cluster and the honest gap, as in the Kubernetes example above. Hiring teams can work with a bounded gap. They cannot work with a fog of "familiar with."
When you are deciding what to learn, refuse isolated nodes. If a course does not attach to an existing cluster or close a load-bearing gap, it is entertainment. That sounds harsh because the alternative is a list that grows forever and never gets denser.
A graph also changes how you write bullets. "Used Redis" is a list item. "Added cache-aside on the product API after measuring P95, with a TTL policy documented in the design note" is a node with depth and proof. The guide to building a skill graph is the longer version of that discipline: names, depth, evidence, then edges.
The takeaway is simple enough to use today. Stop sorting skills by prestige. Map them by connection and proof. The list made you look broad. The graph tells you where you are actually strong, and which one gap is worth closing next.